What is Dashboard?
Managers from all levels require criterion or key performance indicators that are on time, impeccable and fitting in order to work more efficiently, track their work better and make informed decisions.
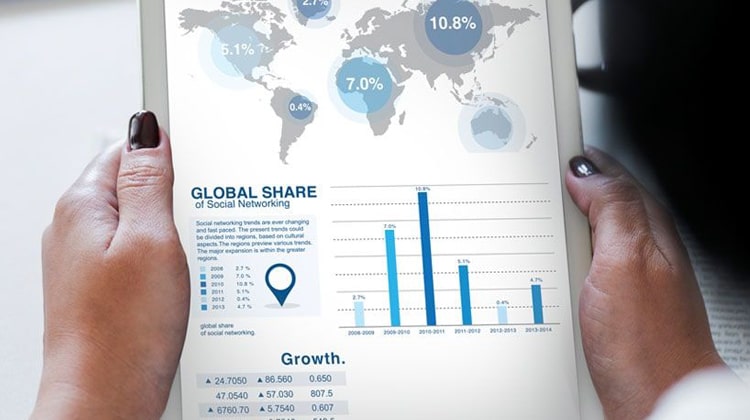
Dashboard shows the data sets collected from various sources or databases, information and connections that are obtained from processing this data in a single page as summary or graphic in order to allow you to make fast and easy decisions about your work.
Dashboard allows managers to track and manage their systems more efficiently. You can start your work day best by getting notified by the dashboard.
Why Dashboard?
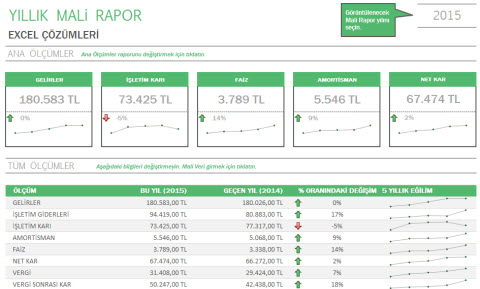
The dashboard enables you to monitor the current work performance data effectively and by visual tools while minimizing your extra information technology cost by saving you from such deeds as continuous maintenance of data warehouse at the same time.
With an easily-comprehensible graphical interface that is tailored to user needs and habits, users can grasp the data in their hands swiftly without the need for additional training and prediction-based results are avoided.
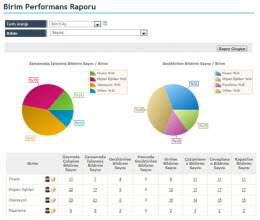
Each dashboard can be customized according to responsibilities, purposes and work field of the relevant user.
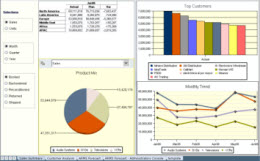
Features of Dashboard Design by Excel:
As Excel Çözümleri, we place importance on developing customer-tailored solutions rather than applying ready-made models. Our approach is based on having applicable solutions.


